🎓 ACT Test Score Calculator
Enter your raw section scores to calculate scaled scores, composite score & percentile estimate
Enter the number of correct answers (raw score) for each section. Leave blank or enter 0 if not taken.
Approximate raw-to-scaled score conversions (standard form). Actual conversions vary slightly by test date.
| Scaled Score | English Raw (of 75) | Math Raw (of 60) | Reading Raw (of 40) | Science Raw (of 40) |
|---|---|---|---|---|
| 36 | 75 | 59–60 | 40 | 40 |
| 35 | 73–74 | 57–58 | 39 | 39 |
| 34 | 71–72 | 55–56 | 38 | 38 |
| 33 | 70 | 53–54 | 37 | 37 |
| 32 | 68–69 | 51–52 | 36 | 36 |
| 31 | 66–67 | 49–50 | 35 | 35 |
| 30 | 64–65 | 47–48 | 34 | 34 |
| 29 | 62–63 | 45–46 | 33 | 33 |
| 28 | 60–61 | 43–44 | 32 | 32 |
| 27 | 57–59 | 41–42 | 31 | 31 |
| 26 | 54–56 | 39–40 | 29–30 | 29–30 |
| 25 | 51–53 | 37–38 | 27–28 | 27–28 |
| 24 | 48–50 | 35–36 | 25–26 | 25–26 |
| 23 | 45–47 | 33–34 | 23–24 | 23–24 |
| 22 | 43–44 | 31–32 | 21–22 | 21–22 |
| 21 | 41–42 | 29–30 | 19–20 | 19–20 |
| 20 | 38–40 | 26–28 | 17–18 | 17–18 |
| 19 | 35–37 | 23–25 | 15–16 | 15–16 |
| 18 | 32–34 | 20–22 | 13–14 | 13–14 |
| 17 | 29–31 | 17–19 | 11–12 | 11–12 |
| 16 | 26–28 | 14–16 | 9–10 | 9–10 |
| 15 | 23–25 | 11–13 | 7–8 | 7–8 |
| 14 | 20–22 | 8–10 | 6 | 6 |
| 13 | 17–19 | 6–7 | 5 | 5 |
| 12 | 14–16 | 4–5 | 4 | 4 |
| 10 | 10–12 | 3 | 3 | 3 |
| 8 | 6–9 | 2 | 2 | 2 |
| 5 | 3–5 | 1 | 1 | 1 |
| 1 | 0–2 | 0 | 0 | 0 |
| Composite Score | Percentile Rank | College Tier | Students Scoring at/below |
|---|---|---|---|
| 36 | 99%+ | Elite (MIT, Harvard) | Top 1 in 100,000 |
| 35 | 99% | Elite Ivy+ | Top 0.5% |
| 34 | 99% | Highly Selective | Top 1% |
| 33 | 98% | Highly Selective | Top 2% |
| 32 | 97% | Selective | Top 3% |
| 30 | 93% | Selective | Top 7% |
| 28 | 88% | Competitive | Top 12% |
| 26 | 82% | Competitive | Top 18% |
| 24 | 74% | Average–Good | Top 26% |
| 22 | 63% | Average | Top 37% |
| 20 | 49% | National Average | Top 51% |
| 18 | 34% | Below Average | Top 66% |
| 16 | 20% | Below Average | Top 80% |
| 14 | 10% | Low | Top 90% |
| 12 | 4% | Very Low | Top 96% |
| Section | Questions | Time (min) | Avg Scaled Score | Topics Covered |
|---|---|---|---|---|
| English | 75 | 45 | 20.2 | Grammar, Punctuation, Style |
| Mathematics | 60 | 60 | 20.3 | Algebra, Geometry, Trig |
| Reading | 40 | 35 | 21.2 | Comprehension, Inference |
| Science | 40 | 35 | 20.9 | Data Analysis, Reasoning |
| Writing (opt.) | 1 essay | 40 | — | Analytical writing, 2–12 scale |
DISCLOSURE: This post may contain affiliate links, meaning when you click the links and make a purchase, I receive a commission. As an Amazon Associate I earn from qualifying purchases.
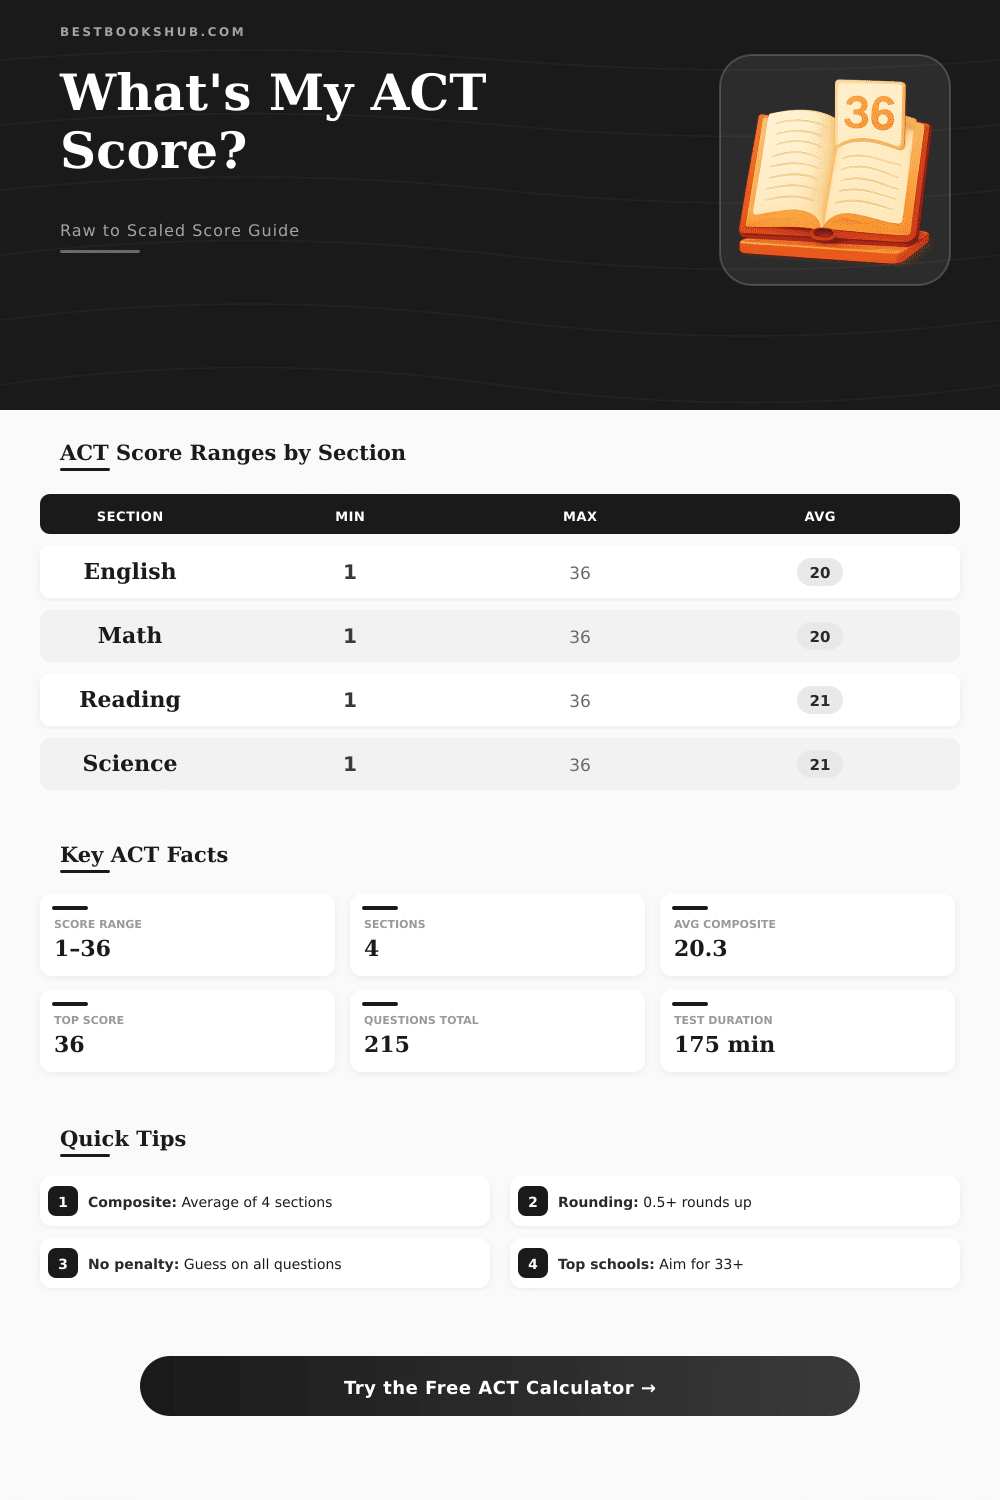
The ACT uses a scale of 1 to 36. You receive individual points for each of the four sections; English, math, reading and science, also on that same scale Your total score is simply the mean of those four sections, rounded to the nearest whole number. When some talk about their ACT score, they almost always mean this combined result.
Here is how the score actually works: you win one point for every right answer. There is no penalty for mistakes, which is good. Your raw score is only the total number of right answers in a section.
How ACT Scores Work
After that, the creators of the test convert your raw score to a scaled score using a conversion table. That happens because two students that do the test on different dates could have different raw points but ultimately receive the same scaled result. The conversion adjusts based on how hard the particular test was to keep everything fair for all.
Recall that different test dates use different conversion grids.
The sections of English, math and reading also have subscores between 1 and 18. Here it becomes a bit confuzed, your section score is not only the simple sum of those subscores.
Most students end around 20 or 21. A score of 30 is very good and like what you see at universities as UGA or Ohio State. The national mean is 19.
Students that reach 22 are at what is considered the minimum for high probability of college completion. If you jump to 26, you are in the 83rd percentile, which is impressive. For a score of 22, the national rank is 72, that means that 72 percent of recent high school grads reached that level or less.
Percentile ranks tell you what percentage of test-takers reached your mark or less. That is useful information when you try to see how competitive you would be at a particular school, especially if you know where their accepted students usually fall.
Ivy League schools are at the top of the competitiveness. Most of them want to see a score around 34. The mean of Harvard for accepted students is about 34, while the University of Massachusetts Boston accepts folks closer to 23.
Scholarships commonly have a minimum at 28, 30 or higher. It is worth checking what every school publishes because a retake could open doors to financial help. From what I saw in practice tests with steady points around 26, a strategic retake can push your total upward by 2 to 4 points.
Bigger jumps usually happen when you start lower, although the progress becomes slower the more you get close to the top.
ACT scores usually appear after some weeks. Digital points arrive more quickly than paper ones. You can log in to your MyACT account to get your results and detailed reports.
Ultimately, a careful review of what went wrong and building a solid base gives more results than only doing endless practice tests.