📊 PSAT to SAT Score Calculator
Estimate your SAT score range from your PSAT/NMSQT results using official concordance data
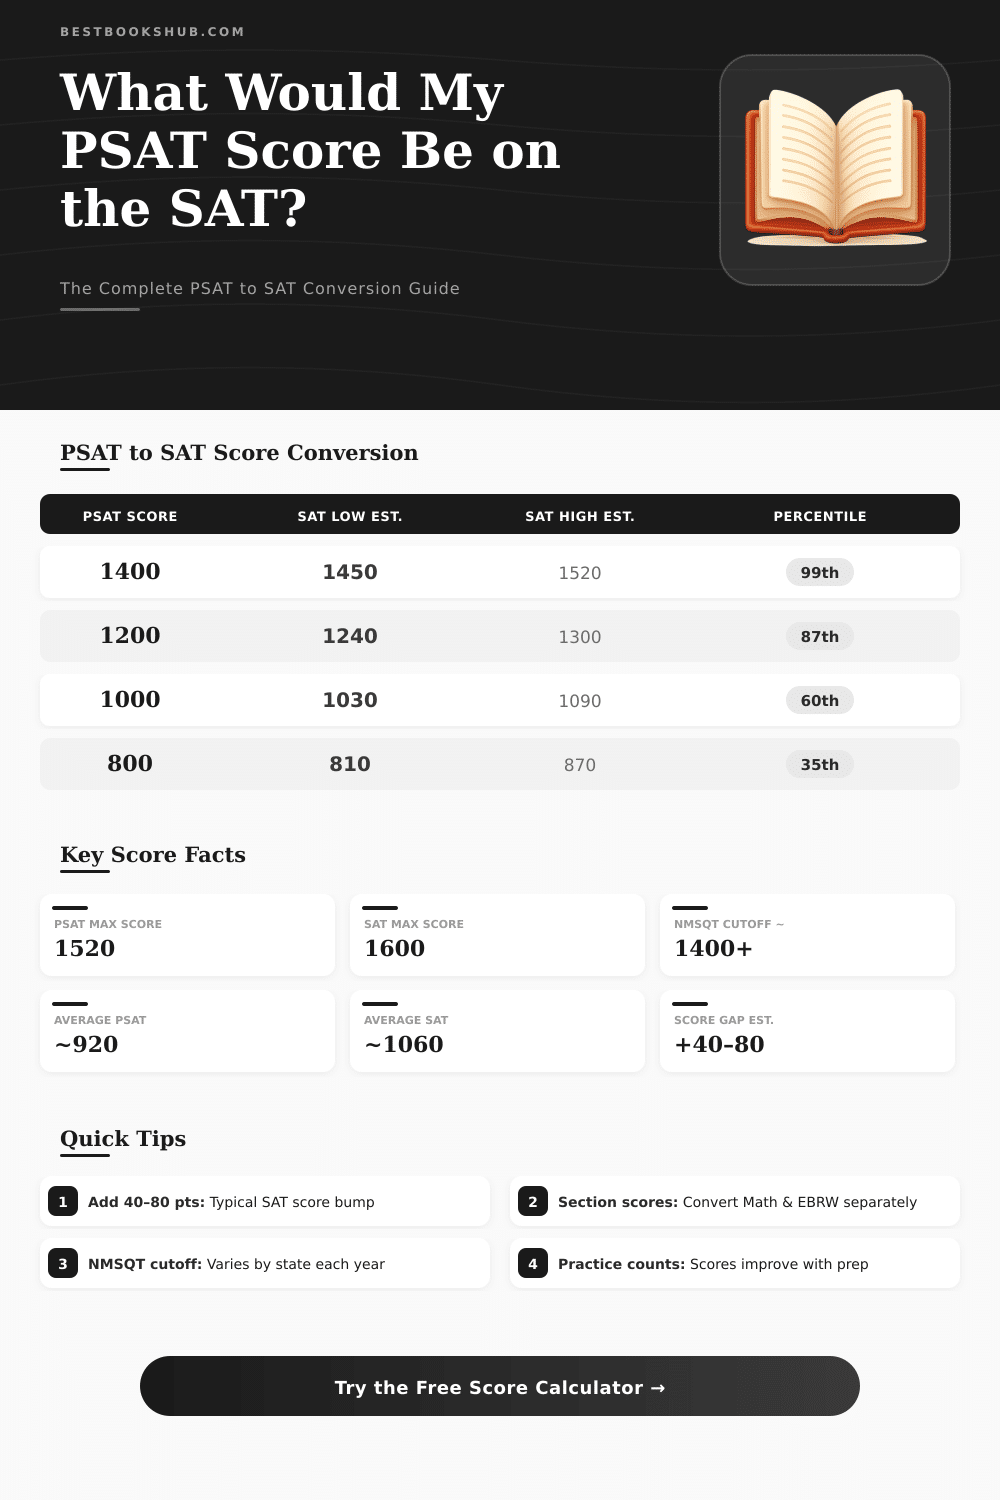
| PSAT Score | SAT Low Est. | SAT High Est. | SAT Midpoint | Percentile (SAT) | NMSqT Qualifier? |
|---|---|---|---|---|---|
| 1520 | 1570 | 1600 | 1590 | 99th+ | ✅ Yes (all states) |
| 1460 | 1500 | 1560 | 1530 | 99th | ✅ Yes (most states) |
| 1400 | 1440 | 1510 | 1475 | 97th–99th | ✅ Yes (many states) |
| 1350 | 1390 | 1450 | 1420 | 95th–97th | ⚠ Borderline |
| 1300 | 1340 | 1400 | 1370 | 91st–95th | ❌ Usually No |
| 1200 | 1240 | 1300 | 1270 | 85th–90th | ❌ No |
| 1100 | 1130 | 1190 | 1160 | 72nd–78th | ❌ No |
| 1060 | 1090 | 1150 | 1120 | 65th–70th | ❌ No |
| 1000 | 1030 | 1090 | 1060 | 55th–62nd | ❌ No |
| 920 | 950 | 1010 | 980 | 45th–52nd | ❌ No |
| 800 | 820 | 880 | 850 | 28th–35th | ❌ No |
| 680 | 700 | 760 | 730 | 16th–22nd | ❌ No |
| PSAT Section Score | Est. SAT Section (Low) | Est. SAT Section (High) | Score Scale Note |
|---|---|---|---|
| 760 (Max PSAT) | 770 | 800 | SAT max is 800 per section |
| 700 | 710 | 750 | High performer range |
| 650 | 660 | 700 | Strong performer |
| 600 | 610 | 650 | Above average |
| 550 | 560 | 595 | Average SAT range |
| 500 | 510 | 545 | Near national average |
| 450 | 460 | 495 | Below average range |
| 400 | 410 | 445 | Needs improvement |
| 350 | 355 | 390 | Significant prep needed |
| 300 | 305 | 335 | Foundational skill gaps |
| PSAT Score | Est. SAT (Midpoint) | Points to SAT 1200 | Points to SAT 1400 | Points to SAT 1600 |
|---|---|---|---|---|
| 1400 | 1475 | Already there | Already there | +125 |
| 1300 | 1370 | Already there | +30 | +230 |
| 1200 | 1270 | Already there | +130 | +330 |
| 1100 | 1160 | +40 | +240 | +440 |
| 1000 | 1060 | +140 | +340 | +540 |
| 920 | 980 | +220 | +420 | +620 |
| 800 | 850 | +350 | +550 | +750 |
The PSAT and SAT are very similar in content. They both test the math skills of students together with reading and writing of English. Both have the same structure with two main parts: Reading & Writing plus Math.
DISCLOSURE: This post may contain affiliate links, meaning when you click the links and make a purchase, I receive a commission. As an Amazon Associate I earn from qualifying purchases.
The whole score comes by means of adding the two sections. Even so they differ in scoring. SAT scores until 1600, while PSAT reach a maximum of 1520.
PSAT and SAT: Simple Guide
PSAT lasts 15 minutes less than SAT and has fewer questions. SAT is for college admission, but PSAT operates as a practice test and qualification for the National Merit Scholarship Program.
PSAT scores range between 320 and 1520. For the sections of Verbal and Math one gives from 160 until 760. The total SAT score goes from 400 to 1600.
Although the scales are different, your result in PSAT/NMSQT shows what you could get in SAT. It intends to be equivalent. For instance, 1450 on PSAT means 1450 on SAT same day.
Similarly, 1100 on PSAT shows 1100 on SAT if you would do it then. Like this the total PSAT directly shows the total SAT.
By means of the PSAT score report students find their strengths and weaknesses. That helps them decide what to study before the real SAT. It reveals whether algebra requires review or whether time lacked.
PSAT shows what will come in SAT. Students like this identify causes to focus and do well. The points include raw, total, section, test, cross-test, sub-scores and percentile.
In their College Board account you see them on-line at studentscores.collegeboard.org. Here you can log in for results of SAT, Subject Tests, PSAT/NMSQT, PSAT 10 and PSAT 8/9. SAT on a weekend shows scores in one place.
For school-given SAT, PSAT/NMSQT or PSAT 10 the information is likewise accessible.