🔬 Research reading planner
Scientific paper reading time calculator
Estimate active reading time for journal articles, preprints, systematic reviews, dense methods papers, figures, tables, annotations, and citation follow-up.
| Reader or task | Typical speed | Best use | Reading caveat |
|---|---|---|---|
| Child reader | About 100 wpm | Early school text | Not suited to research articles |
| Adult nonfiction reader | 200-300 wpm | General comprehension | Too fast for dense methods |
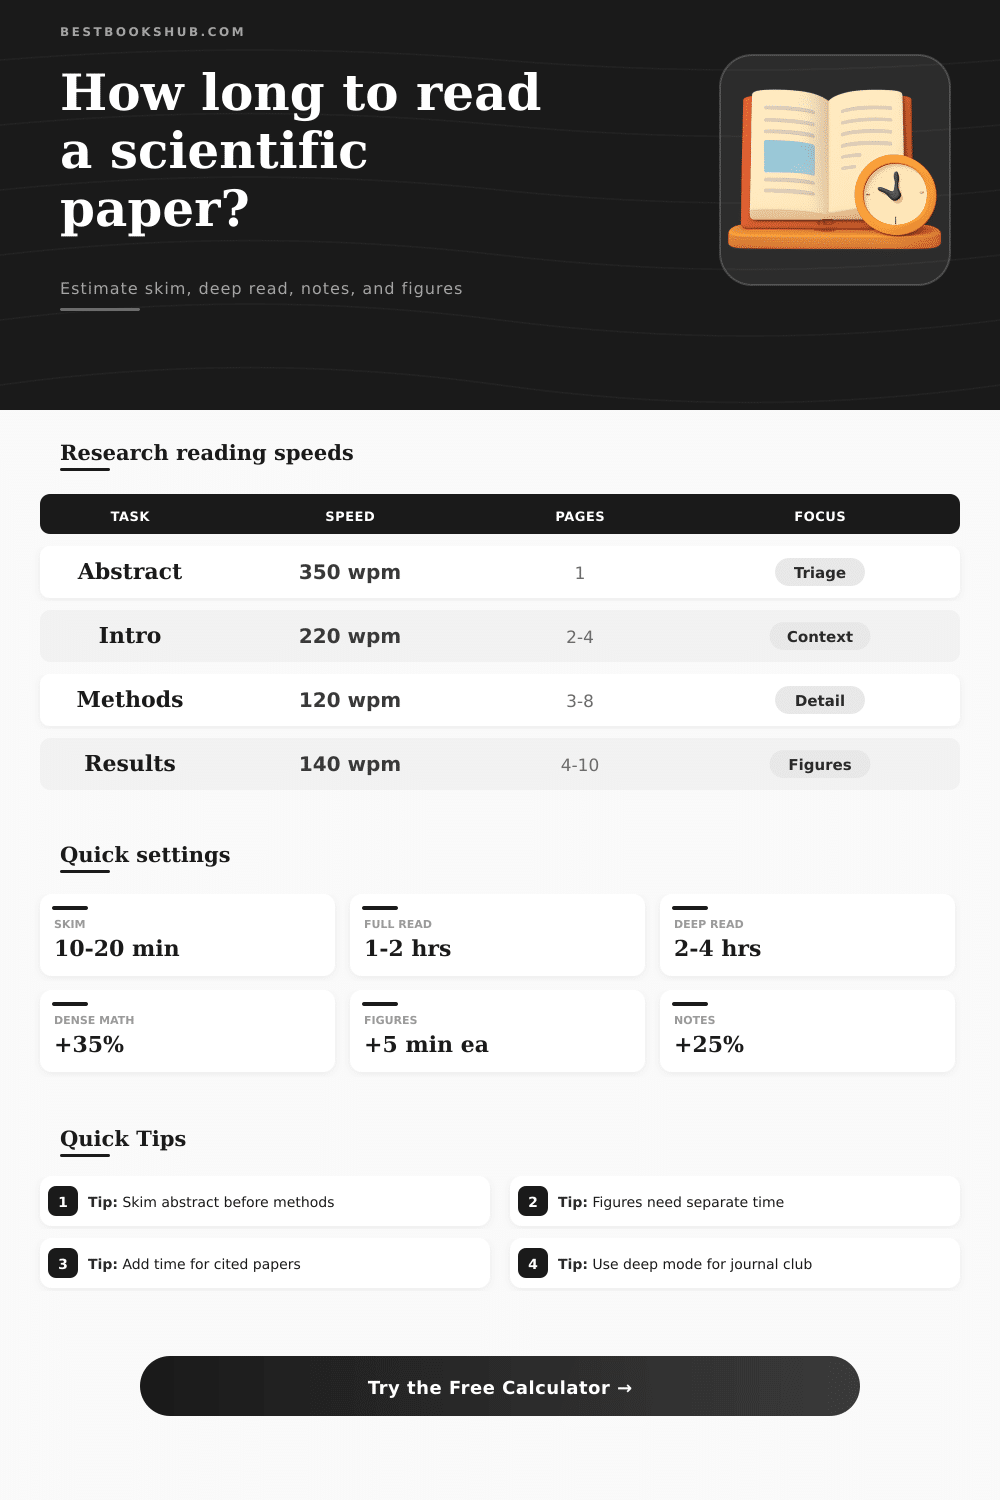
| Scientific full read | 120-180 wpm | Technical comprehension | Assumes limited rereading |
| Critical appraisal | 80-140 wpm | Methods and results review | Figures are separate work |
| Speed reading scan | 500+ wpm | Rapid triage | Not a deep-read pace |
| Page or format type | Words per page | Comparable book data | When to adjust |
|---|---|---|---|
| One-column manuscript draft | 250-350 | Trade paperback about 300 words/page | Use for submitted manuscripts |
| Two-column journal PDF | 500-750 | Hardcover about 350 words/page | Use for published articles |
| Table-heavy page | 250-500 | Textbook density varies widely | Add figure review minutes |
| Math-heavy page | 150-350 | Dense textbook pages read slower | Lower wpm for equations |
| Mass market book page | About 250 | Useful baseline only | Not equal to journal layout |
| Paper section | Typical share | Time multiplier | Why it changes pace |
|---|---|---|---|
| Abstract | 150-300 words | 0.55x | Fast triage of purpose and claim |
| Introduction | 15-25% | 0.85x | Context usually reads faster |
| Methods | 20-35% | 1.35x | Protocol detail slows reading |
| Results | 20-35% | 1.25x | Requires figures and statistics |
| Discussion | 15-25% | 1.00x | Interpretation and limitations |
| Extra task | Typical add-on | Calculator basis | Use case |
|---|---|---|---|
| Quick figure caption check | 1-2 min each | 1.5 min per figure | Structured skim |
| Standard figure reading | 3-5 min each | 4 min per figure | Full comprehension |
| Data extraction | 6-10 min each | 8 min per figure | Review or replication |
| Open cited source | 4-8 min each | 6 min per source | Tracing claims |
| Supplement page | 1-3 min each | 2 min per page | Appendix or protocol checks |
DISCLOSURE: This post may contain affiliate links, meaning when you click the links and make a purchase, I receive a commission. As an Amazon Associate I earn from qualifying purchases.
It’s another day. You grab your copy of new journal in your field, pour yourself a cup of coffee and begin to read. The title seem right; the abstract sounded relevant; it is only 45 minutes until your next meeting. It begins.
Ten pages later, you’re hopelessly stuck in statistics, confused about a figure that doesn’t seem to jibe with what’s written on page, and have no clue what the point was supposed to be. This happens far too often. As researchers, we approach each line of text equally. We think that it takes us the same amount of brain power to wade through twenty pages of text, regardless of content. That’s why study plans fails.
Why Reading Science Articles Is Harder Than You Think
Science articles are not novels. Skimming the methods section means you might lose track of reproducibility. You won’t be able to rush through a complicated statistical model at your typical reading pace. Why? Because the mental effort is different than. It’s not about recognizing words, but interpreting meaning from dense terminology or complex data visualizations. When your brain hits that type of content, it slows down.
If you have a tool that adjusts for this variance, it can helps you go from guessing to planning. Enter the page count, figure density, and tell it what you want to achieve. And it will provide realistic timeline (not some hopeful guess). It’s not about the tally… It’s about the inputs.
Think of the difference between critical appraisal and triage. If you’re doing triage, you’re filtering. Is the paper worth my time? For that purpose, you skim text, taking in its structure and claims without diving deeply into details of the validations. When you’re doing critical appraisal, the reverse is true. You’re looking for cracks in the design or logical argument. That slows things down (often dropping below 100 words-per-minute when dealing with equations). The calculator considers this change of intent. It knows that learning and judging rely on different kind of reading.
People tend to overestimate the time spent learning but underestimate the time spent judging, mixing up evaluation with comprehension. This is especially true for tables and figures. They’re not just decoration between paragraphs of prose. Often in most fields they are actualy the argument and the prose is the scaffolding. When you interpret the error bars, sample size and axes on each one, it can take multiple minutes per figure. That time triples when you want to extract data for a replication study or a meta-analysis. Failing to account for this cost means you don’t read completely. You get through the PDF but you missed subtlety buried in a bar chart footnote. That’s where the science really lives.
Speed depends heavily on how familiar you are with topic. If it’s a subfield you’re an expert at, then you gloss over the rote memorized parts. If it’s something from another field, then you has to pause and decode each methodological decision and acronym. To account for this difference, if you choose a lower familiarity level, the tool will estimate it takes you longer. And that’s why we need to slow down.
When we believe we know where the argument is going, our tendency is to skim, to miss details that don’t fit our existing biases. By deliberately slowing down, we create room for surprises. Another time sink is supplemental materials, a category that few people think about when budgeting. You read main text, which explains what happened. The supplement explains how it happened. Detailed math steps and extra tests often appear in appendices. Each of these add substantial minutes to your session. Spend two minutes per page if you’re doing a quick check, but if you’re going through thoroughly, each page demand the same concentration as main body. Factor this into your estimate and avoid being frustrated by finding out halfway through reading the article that half the evidence is back in the PDF attachment.
Annotating shifts your brain from just taking in information to actively participating. A highlight feels shallow and fast. Structured notes require immediate synthesis, as does outlining presentation points. This takes time, but it leads to improved retention. It’s no longer just a “read,” but the building of a mental model that lasts long after the session.
The input-output equation shows the tradeoff up front. More input time means more output. Once we accept this truth, we can plan sessions according to our actual energy levels instead of a perfect idea of productivity. This isn’t about reading fast. It’s about reading smart: matching our expectations to the work involved. With a realistic guess, you won’t burn out; each minute will add up to the right amount of value from a paper.
You’ll know when to put it down. You’ll know when to shift focus. You’ll know when to pick it back up again later. Science will get absorbed while the coffee remains warm, the meeting gets missed (only if necessary), and you actualy understand what you read. That would of been the whole point of reading in the first place.