📖 Fry Readability Graph Calculator
Determine the reading grade level of any text using the Fry Readability Formula
📘 Sample 1 (100 words)
📙 Sample 2 (100 words)
📚 Sample 3 (100 words)
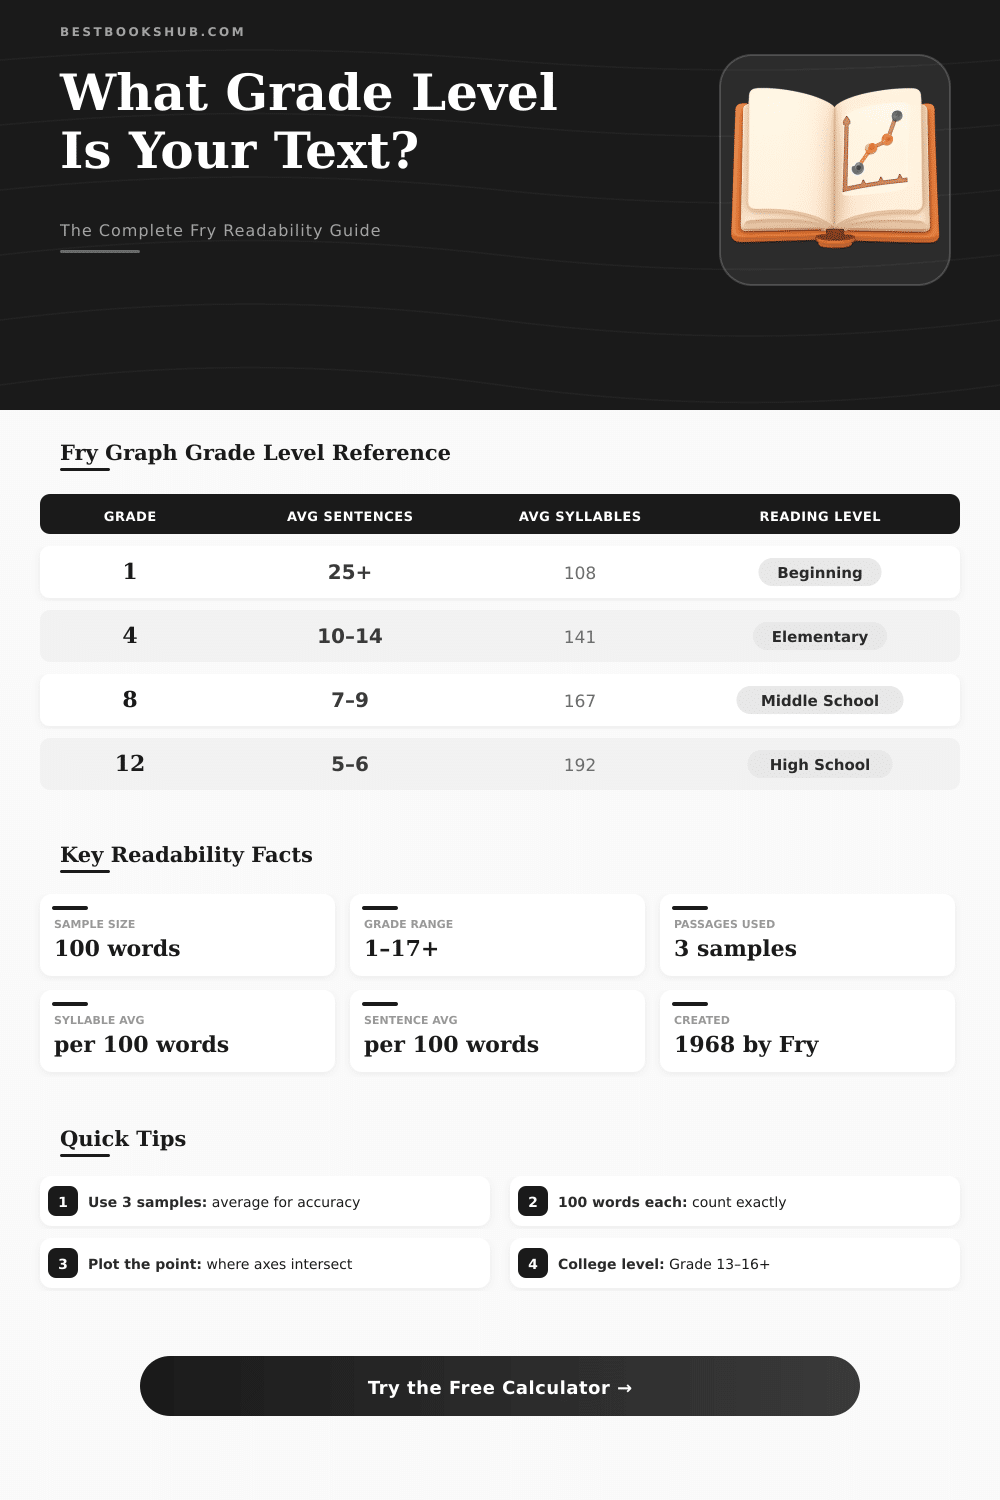
| Grade Level | Avg Sentences (min) | Avg Sentences (max) | Avg Syllables (approx) | Typical Reading Age |
|---|---|---|---|---|
| Grade 1 | 23.0 | ∞ | 108 | 6–7 years |
| Grade 2 | 17.0 | 22.9 | 112 | 7–8 years |
| Grade 3 | 13.5 | 16.9 | 122 | 8–9 years |
| Grade 4 | 11.1 | 13.4 | 133 | 9–10 years |
| Grade 5 | 9.2 | 11.0 | 143 | 10–11 years |
| Grade 6 | 7.7 | 9.1 | 154 | 11–12 years |
| Grade 7 | 6.7 | 7.6 | 162 | 12–13 years |
| Grade 8 | 5.9 | 6.6 | 168 | 13–14 years |
| Grade 9 | 5.3 | 5.8 | 175 | 14–15 years |
| Grade 10 | 4.8 | 5.2 | 182 | 15–16 years |
| Grade 11 | 4.3 | 4.7 | 188 | 16–17 years |
| Grade 12 | 3.9 | 4.2 | 194 | 17–18 years |
| College (13–15) | 3.0 | 3.8 | 200–212 | 18–21 years |
| Graduate (16+) | <3.0 | — | 213+ | 21+ years |
| Word Type | Example | Syllable Count | Counting Rule |
|---|---|---|---|
| Monosyllabic | cat, run, the | 1 | One vowel sound |
| Bisyllabic | run–ning, ta–ble | 2 | Two vowel sounds |
| Trisyllabic | el–e–phant | 3 | Three vowel sounds |
| Silent ‘e’ | make, take, like | 1 | Final e is silent |
| Vowel digraph | boat, rain, feet | 1 | Two vowels = 1 sound |
| Numbers | 1996 = nine–teen–nine–ty–six | 6 | Count spoken syllables |
| Abbreviations | IRS = I–R–S | 3 | Count each letter said |
| Compound words | sun–shine, air–plane | 2 | Count normally |
| Hyphenated | well–known | 2 | Count as one word |
| Proper nouns | Wash–ing–ton | 3 | Count normally |
| Situation | Rule | Example |
|---|---|---|
| Standard sentence | Count as 1 | The cat sat on the mat. |
| Partial sentence at end of 100 words | Count as fraction (words used / total words) | If 7 of 10 words used = 0.7 |
| Dialogue sentence | Count as 1 sentence | “Let's go!” he said. |
| Exclamation / question | Count as 1 | Run! / Where are you? |
| Semicolon-joined clauses | Count as 1 sentence | He ran; she walked. |
| Bullet / list items | Each item = 1 sentence | • Item one • Item two |
| Headings / titles (standalone) | Count as 1 sentence | Chapter Three: The Storm |
| Text / Publication Type | Typical Fry Grade | Avg Syllables /100w | Avg Sentences /100w |
|---|---|---|---|
| Dr. Seuss (early) | Grade 1–2 | 108–115 | 18–25 |
| Magic Tree House series | Grade 2–3 | 115–125 | 13–18 |
| Harry Potter (Book 1) | Grade 4–5 | 135–148 | 9–12 |
| USA Today / Popular Newspaper | Grade 6–7 | 150–165 | 7–9 |
| Time Magazine | Grade 9–10 | 175–185 | 5–6 |
| High School Textbook | Grade 10–11 | 180–192 | 4–5 |
| Scientific American | Grade 12–14 | 190–210 | 3–5 |
| Academic / Research Paper | Grade 14–16+ | 210–230 | 2–4 |
| Legal Documents | Grade 16+ | 220+ | 2–3 |
| Children's Picture Book | Grade 1–2 | 100–115 | 20+ |
Readability charts are tools that measure how hard or easily one reads a piece of text. Among the most known readability charts are the Fry Readability Graph and that of Raygor. They both use methods based on charts to estimate the grade of reading in writings.
DISCLOSURE: This post may contain affiliate links, meaning when you click the links and make a purchase, I receive a commission. As an Amazon Associate I earn from qualifying purchases.
The Fry Readability Graph is made up of a formula and a tool that helps to find the readability of text. Edward Fry created it. It has a scale of 1 to 15, where 1 means the simplest and 15 the most complex.
Fry and Raygor Readability Charts
One counts the level of trouble looking at the average amount of sentences and syllables. Sentences and syllables form the main variables. The Fry Readability Graph shows the readability by means of the crossing between syllables per 100 words and sentences per 100 words.
One marks those patterns on the chart, which gives a score. One built the method testing pieces from texts, with three groups of 100 wrods each.
The Fry Readability Graph also measures how hard it is for non-native speakers of the English language to read unprepared text. This covers elements like vocabulary, syntax and structure.
The Raygor Readability Chart works somewhat differently. Alton L. Raygor created it to estimate the readability of English prose. It forms a two-dimensional pattern on a grid.
The chart estimates texts based on too factors: length of sentences and amount of difficult words each sentence. One lays the number of words with six or more letters on the horizontal axis. Such measures help to show the reading level that a person needs to understand the content.
The Raygor Readability Chart is a formula based on a chart that estimates the American grade level of text. It offers a fast way to sort a bit of writing. In teaching settings it commonly helps to find the readinglevel of books, articles and other resources.
Tools for readability, like these, can help truly in some cases. They prove big value as a method to search thousands of websites, to find the less readable parts, or to quickly check books and articles, where the most difficult pages lie. On the other hand, high scores for readability do not always show that the content is truly better read.
Readability formulas use algorithms to estimate the trouble. Some could easily write nonsense and cheat the systems. So charts for readability stay only one tool, and they do not work for every occasion.