📊 Price to Book Ratio Calculator
Instantly calculate the P/B ratio to assess whether a stock is undervalued or overvalued relative to its book value.
| P/B Range | Interpretation | Investor Signal | Typical Context |
|---|---|---|---|
| Below 0.5× | Deeply Undervalued | 🟢 Strong Buy Signal | Distressed or overlooked stocks |
| 0.5 – 1.0× | Undervalued | 🟢 Value Opportunity | Banks, cyclicals in downturn |
| 1.0 – 1.5× | Near Book Value | 🟡 Fair / Neutral | Traditional industries |
| 1.5 – 3.0× | Moderately Valued | 🟡 Reasonable Premium | Stable growth companies |
| 3.0 – 6.0× | Growth Premium | 🟠 Watch Fundamentals | Tech, healthcare, high-ROE firms |
| 6.0 – 10.0× | Richly Valued | 🔴 High Expectations | High-growth tech / brand stocks |
| Above 10.0× | Speculative / Overvalued | 🔴 Caution Advised | Hyper-growth or bubble signals |
| ROE (%) | Justified P/B (Cost of Equity 10%) | Interpretation | Example Sector |
|---|---|---|---|
| 5% | 0.5× | Below cost of equity — value trap risk | Declining industries |
| 10% | 1.0× | Earns exactly cost of equity | Utilities, banks |
| 15% | 1.5× | Healthy value creation | Consumer staples |
| 20% | 2.0× | Strong earnings power | Industrial leaders |
| 25% | 2.5× | Excellent capital allocation | Financial services |
| 30% | 3.0× | Premium quality business | |
| 40%+ | 4.0×+ | Exceptional returns, moat likely | Top-tier tech / brands |
| Index / Market | Current Avg P/B | 10-Year Avg P/B | Historical Low P/B |
|---|---|---|---|
| S&P 500 (USA) | ~4.3× | ~3.1× | ~1.1× (2009) |
| FTSE 100 (UK) | ~1.7× | ~1.9× | ~0.9× (2020) |
| DAX (Germany) | ~1.8× | ~1.7× | ~0.8× (2009) |
| Nikkei 225 (Japan) | ~1.4× | ~1.3× | ~0.7× (2012) |
| MSCI Emerging Mkts | ~1.7× | ~1.6× | ~1.0× (2016) |
| BSE Sensex (India) | ~3.2× | ~2.8× | ~1.7× (2020) |
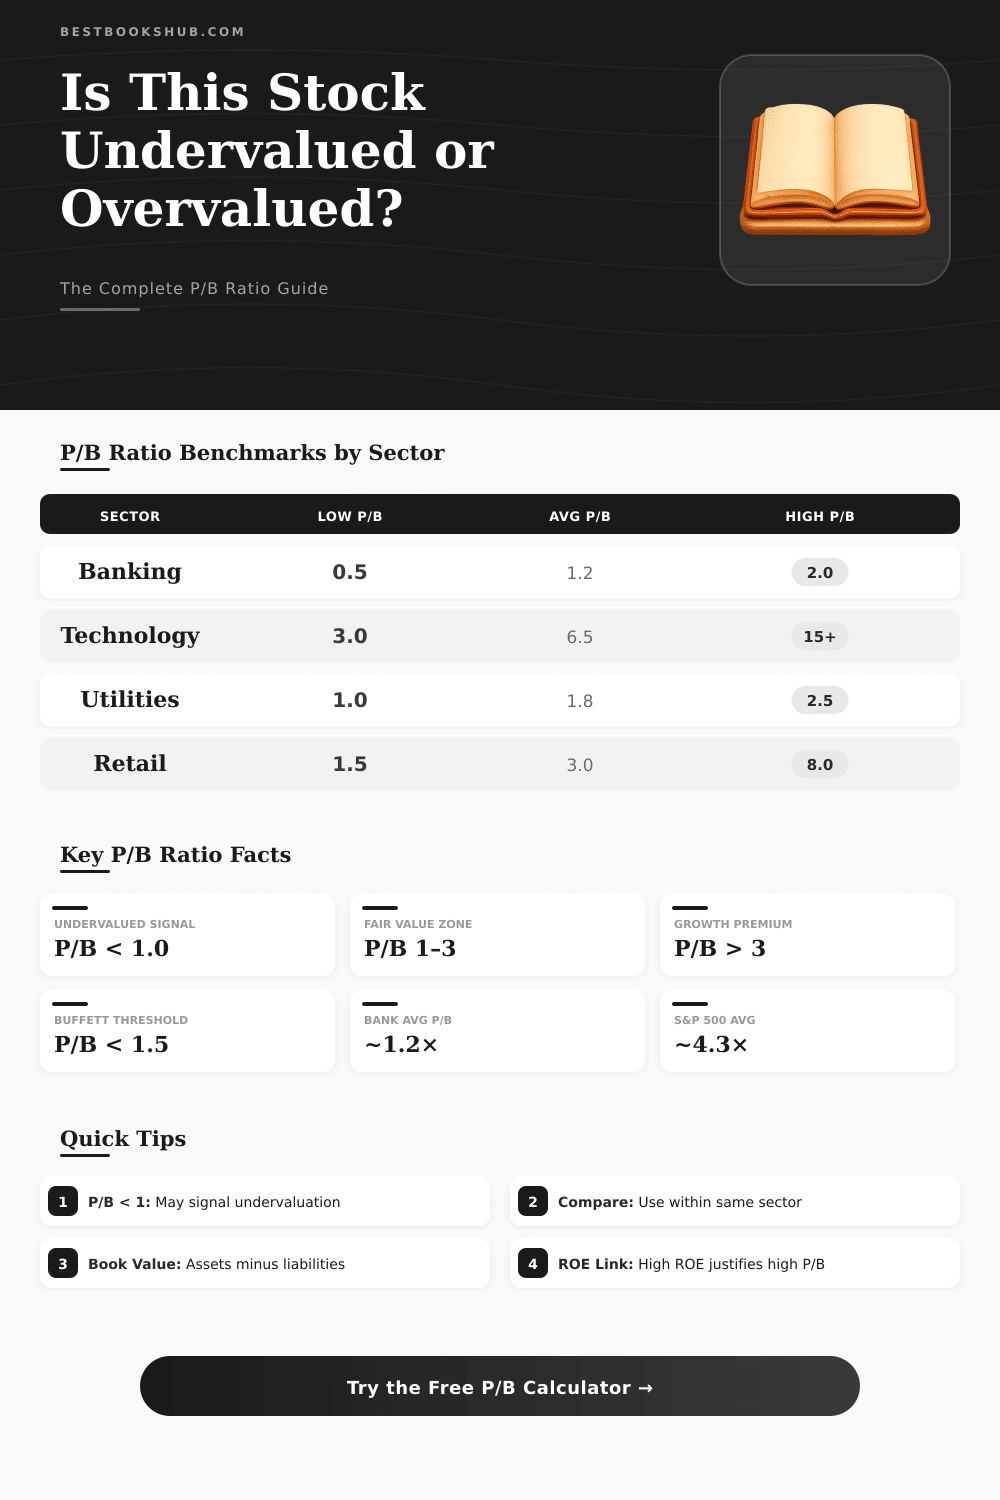
P/B ratios vary widely by industry. A P/B of 0.8× is normal for some banks but alarming for a tech company. Always benchmark against sector peers, not the broad market average.
If a company carries significant goodwill or intangible assets, use the Tangible Book Value per share (book value minus intangibles) for a more conservative and accurate P/B calculation.
The price to book ratio, usually called P/B ratio, is a financial measure that compares the market value of a company with the value of its reserves. The book value of a company is made up of the final value of its things, as one finds them in the balance sheet. One counts it by taking the total debts from the total things.
DISCLOSURE: This post may contain affiliate links, meaning when you click the links and make a purchase, I receive a commission. As an Amazon Associate I earn from qualifying purchases.
Simply it shows what would stay, if the company would sell all things and would pay all debts. Basically, that is the shareholder money.
What is the Price-to-Book (P/B) Ratio?
Investors count the P/B ratio by sharing the market price of the shares by the book value per share. Like this it points, how much one pays for every unit of final things. The measure ties the opinion of the market about the value of the company with the actually listed values of its thnigs.
When a company has P/B of 1, its market price matches the book value. Scores of 1 or lower commonly count as reliable, although values up to 2 also can be fine. What is a “good” value depends much on the industry.
In the technology branch, that depends strongly on invisible things, the middle price to book ratio reach around 7.3, what is the highest. Even in sectors with physical things, the numbers range a lot.
Market price under the book value does not always show, that the company is ignored. The book value of certain items can bee too high or too low. Looking only at the visible book value helps, because it leaves out invisible things and goodwill, that commonly gets added to the books only after buying.
For technology or software companies with few things, other measures like price-to-earnings ratio, cash flow and growth meters usually matter more than P/B. A good example is a biotech company with one well sold drug and ten others in its early line. Those early drugs could be worth billions or entirely nothing.
Their potential future profit does not show in the book value. The ratio works better for small local banks, because their balance sheets are much more simple.
The book value is based on the past costs of the things. The business of a company looks to future income. Because of that some reckon, that book values are not useful.
The price to book ratio is like another measure called Tobin Q ratio. The main difference is, that Tobin Q uses the replacement value of the things of the company instead of the book value. Both have the same goal, namely themarket value of the company.
Sometimes one trades shares under the book value, because investors want bigger output for the extra risk. That drop shows the market view about the growth and the profit of the money.