🦋 Simpson Diversity Index Calculator
Enter species names & individual counts to calculate D, 1–D, and 1/D with full interpretation
| # | Species / Group Name | Individual Count (ni) |
|---|
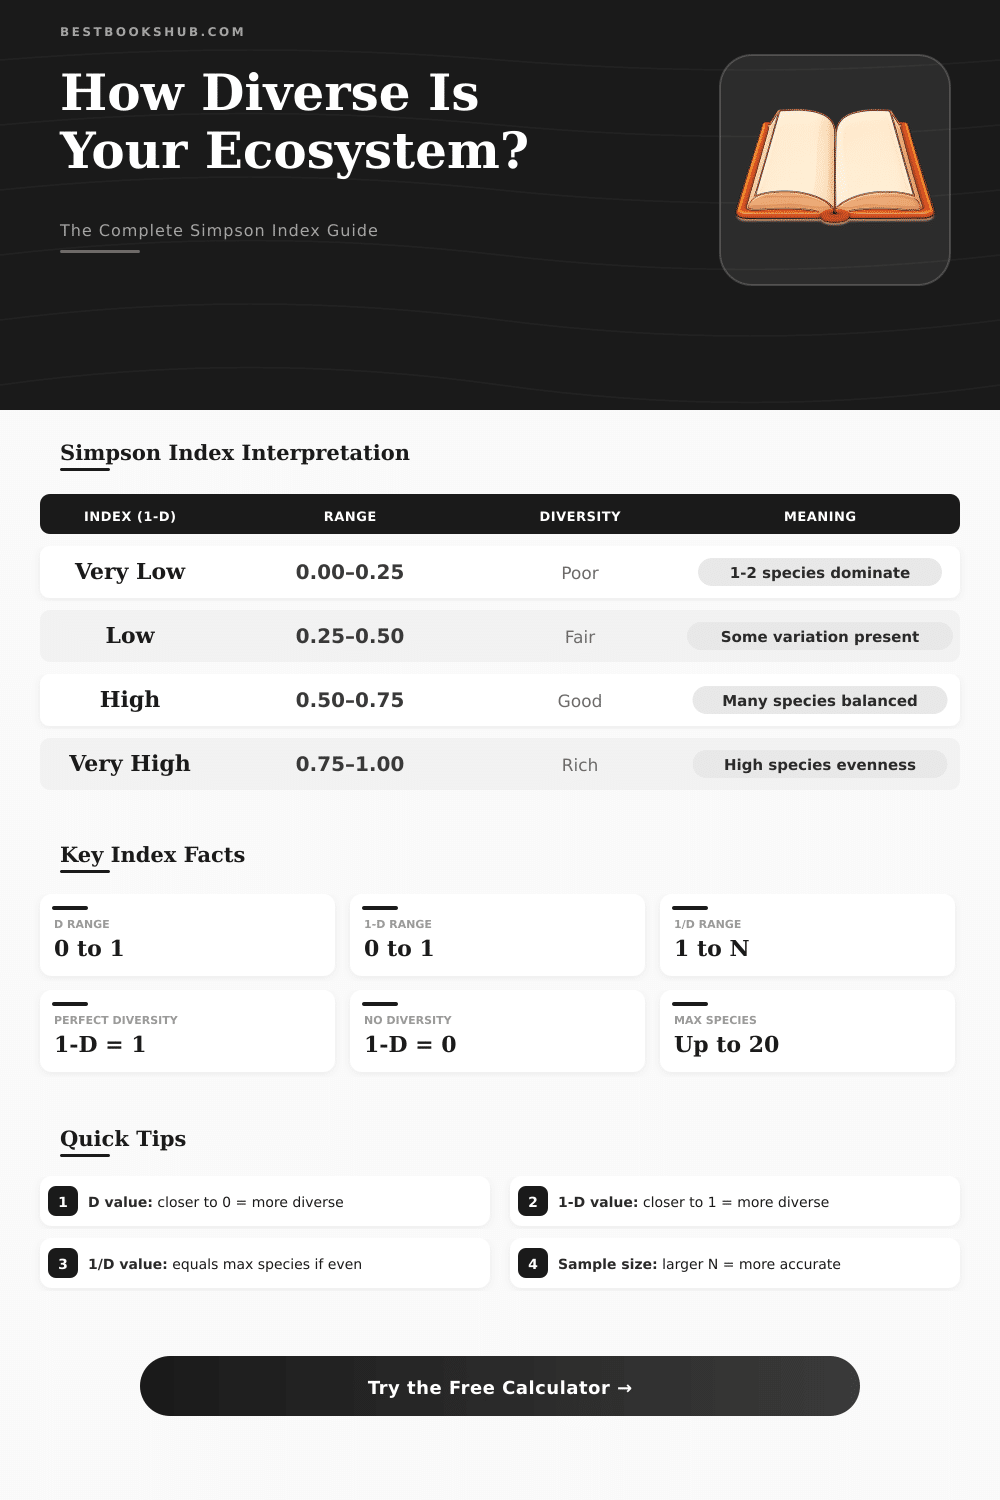
| D (Simpson's Index) | 1−D (Diversity Index) | 1/D (Reciprocal Index) | Interpretation | Typical Ecosystem Example |
|---|---|---|---|---|
| 0.95–1.00 | 0.00–0.05 | 1.00–1.05 | Extremely Low Diversity | Agricultural monoculture |
| 0.75–0.95 | 0.05–0.25 | 1.05–1.33 | Very Low Diversity | Degraded urban habitat |
| 0.50–0.75 | 0.25–0.50 | 1.33–2.00 | Low–Moderate Diversity | Managed grassland |
| 0.25–0.50 | 0.50–0.75 | 2.00–4.00 | Moderate–High Diversity | Temperate forest edge |
| 0.10–0.25 | 0.75–0.90 | 4.00–10.00 | High Diversity | Mature temperate forest |
| 0.00–0.10 | 0.90–1.00 | 10.00+ | Very High Diversity | Tropical rainforest, coral reef |
| Community | Species Counts | N (Total) | D Value | 1−D | 1/D |
|---|---|---|---|---|---|
| Monoculture | 100 | 100 | 1.000 | 0.000 | 1.00 |
| 2 Equal Species | 50, 50 | 100 | 0.495 | 0.505 | 2.02 |
| 3 Equal Species | 33, 33, 34 | 100 | 0.333 | 0.667 | 3.00 |
| 5 Equal Species | 20, 20, 20, 20, 20 | 100 | 0.200 | 0.800 | 5.00 |
| Uneven 5-species | 60, 20, 10, 7, 3 | 100 | 0.432 | 0.568 | 2.31 |
| 10 Equal Species | 10 x 10 each | 100 | 0.099 | 0.901 | 10.10 |
| Index | Formula | Range | Higher Value Means | Best Used For |
|---|---|---|---|---|
| Simpson's D | ∑[n(n−1)] / [N(N−1)] | 0 – 1 | Less diverse | Dominant species focus |
| Simpson's 1−D | 1 − D | 0 – 1 | More diverse | General ecology reports |
| Simpson's 1/D | 1 / D | 1 – S | More diverse | Effective species count |
| Shannon–Wiener H' | −∑[p ln(p)] | 0 – ln(S) | More diverse | Rare species sensitivity |
| Shannon Evenness J | H' / ln(S) | 0 – 1 | More even | Community evenness |
| Species Richness S | Count of species | 1 – ∞ | More species | Simple diversity snapshot |
Species counts only tell you about number of species present in a community. To get an idea of evenness; how evenly individuals are distributed among species, you can use diversity index calculations that provides a better picture of the community’s health. Calculate diversity indices for free at the Simpson Diversity Index Calculator. It automaticaly interprets your results (and breaks them down by species).
DISCLOSURE: This post may contain affiliate links, meaning when you click the links and make a purchase, I receive a commission. As an Amazon Associate I earn from qualifying purchases.
Enter the species count information into calculator below:
What Is the Simpson Diversity Index?
Edward Simpson devised the index as part of his research into plankton in 1949. It proved to be useful across many biological field. Ornithologists and those researching soil microbiology takes it up.
How does it work? It measures the chances that two randomly picked individual from a community belong to same species. If it’s highly likely then the species are not diverse. If it’s very unlikely then you have a healthy and even mix. This makes sense and explains why it has remained popular.
Enter names of all your species, then the numbers present. Rare species is weighted less than abundant species. High species diversity isn’t necessarily good if a few dominate system. The 1−D value produced is between zero and one, with higher values meaning no single group dominates use of resources.
The index is a tool for conservationists to target areas where they should of put more effort into protecting the land. It’s something farmers look at to see how their soil recovers from monoculture farming. Urban planners use insect and bird biodiversity levels in their parks to predict how resilient those spaces will be to disease and heat waves.
If your number comes back low, it doesn’t necessarily mean doom just that maybe the system is susceptible to collapse. One limitation is that index doesn’t account for who is being counted, only their relative abundance (i.e., number). For example, a grassy meadow will get rated equally than an orchid-rich one. To compensate, ecologists typically also list species richness counts along with Shannon’s index of diversity. This calculator generates those complementary figures so you can compare them side by side.
A small sample will also impact the reliablity of your results. A survey with less than 30 individuals will have large variations from one to another. Confidence in a given number are greater with larger numbers. The formulas is designed to account for this type of sampling without replacement. When it’s not possible to count each and every individual, this adjustment still keeps the math accurate.
“With the Simpson Diversity Index I’m able to spot patterns of abundance that would have been invisible. It makes you aware of what dominates and what is rare. Whether looking at a restored wetland or compost pile, it gives me another way of seeing the landscape. It is a way that allows for interpretation. And then there’s that language from calculator to make sense of what you’re seeing. Perhaps it will inspire you to protect functional ecosystems.”