📚 Grade planning
Class Grade Calculator
Forecast a weighted class grade from homework, quizzes, tests, projects, participation, and the final exam. Check targets, buffers, and pass risk in one place.
Enter each category as a weight and an average. The calculator normalizes the weights if they do not add to 100, which makes it useful for unusual or incomplete gradebooks.
DISCLOSURE: This post may contain affiliate links, meaning when you click the links and make a purchase, I receive a commission. As an Amazon Associate I earn from qualifying purchases.
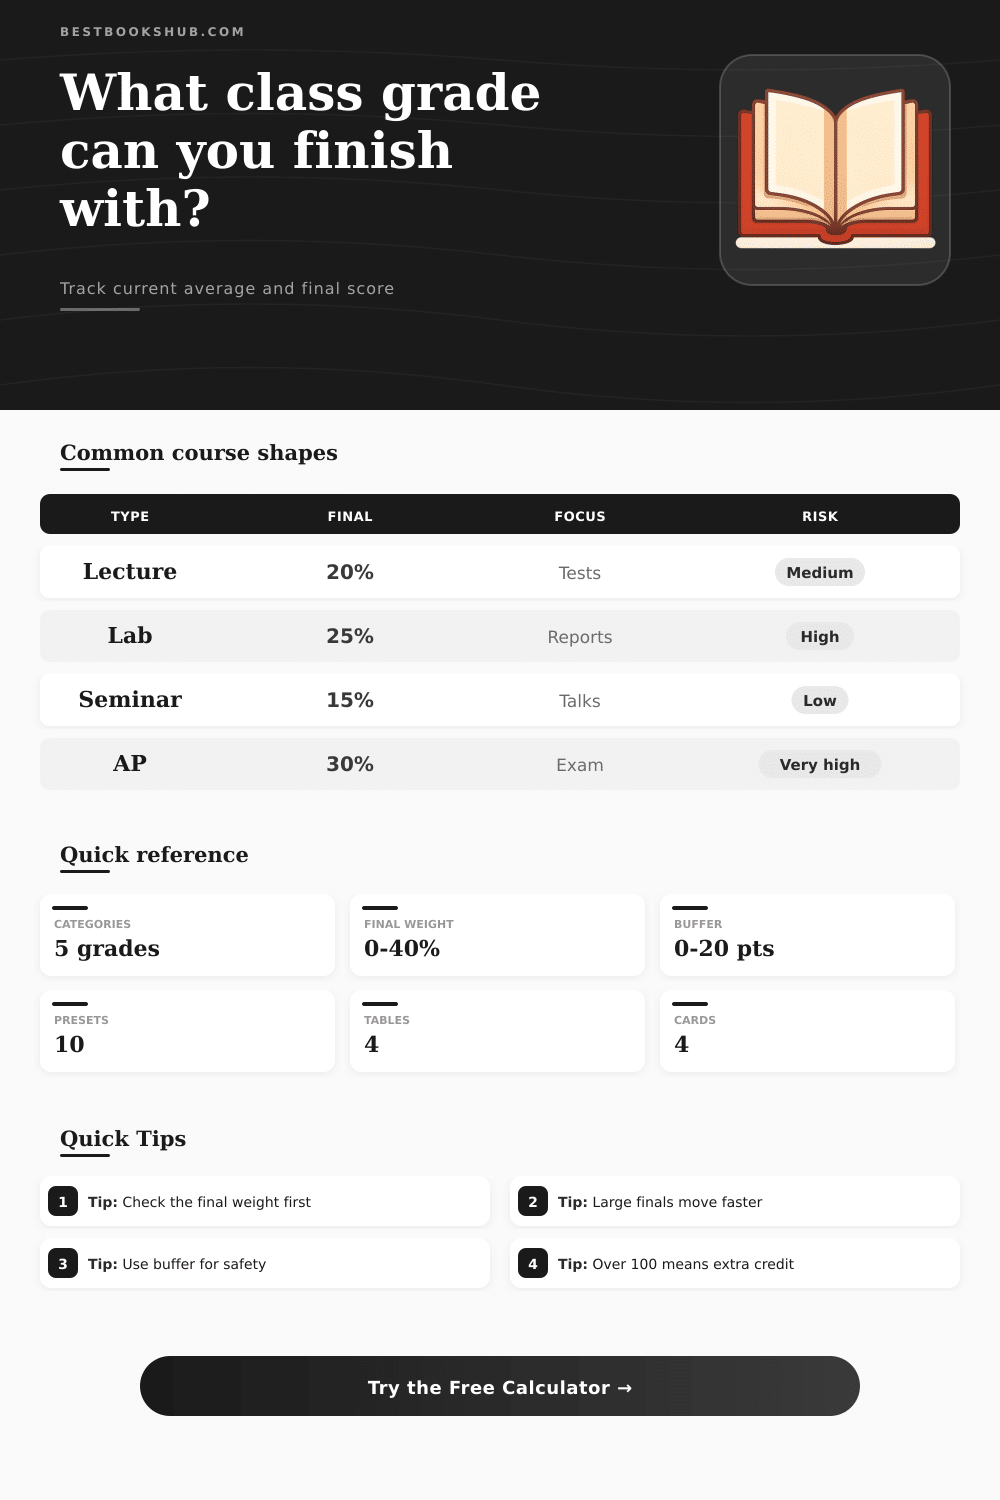
Use these tables to sanity-check common course shapes, final weight leverage, and the grading scale behind the calculator.
| Course shape | Final weight | Main driver | Risk |
|---|---|---|---|
| Lecture | 10-20% | Tests | Medium |
| Lab science | 15-25% | Reports | High |
| Project class | 15-30% | Portfolios | Mixed |
| Seminar | 0-15% | Talks | Low |
| Final weight | 10-point final swing | Meaning | Pressure |
|---|---|---|---|
| 5% | 0.5 pts | Light | Low |
| 10% | 1.0 pts | Small | Medium |
| 20% | 2.0 pts | Strong | High |
| 30% | 3.0 pts | Heavy | Very high |
| 40% | 4.0 pts | Huge | Extreme |
| Scale | A | B | C | Pass |
|---|---|---|---|---|
| Standard | 90 | 80 | 70 | 60 |
| Plus/minus | 93 | 83 | 73 | 60 |
| Strict | 95 | 85 | 75 | 65 |
| Curve aware | Ask | Ask | Ask | Ask |
| Current avg | Final wt. | Target | Needed final |
|---|---|---|---|
| 84% | 20% | 90% | 114% |
| 88% | 10% | 90% | 108% |
| 72% | 40% | 75% | 82.5% |
| 95% | 15% | 97% | 110.7% |
The class grades are the final points that you receive after ending a quarter semester or whole year of course. They usually come from various parts, for instance homework, classwork, tests, quizzes and the final exam. Each of those parts is a percentage of the whole grade.
In a system based on percentages, every task gives a percent score. For instance, four right answers from five match 80 %. The total grade is weighted according to the stated proportions of different work kinds.
How School Grades Work
Some classes use threshold-based grading where above 90 % give A, 85 % give B+, and so on. Other classes use a distrbution-based system instead.
Grading on a curve is a general term with several different meanings. It commonly just means moving up the grades. In a well done curve you can theoretically pass, if the whole class does well.
The median grade through all classes at one university reached 3.02, which was typical for more than 25 years.
A-grades are that common today, that B feels like failure. B should mean good performance with some weaknesses. Before it meant mastery, and only few students wood receive it.
The words “class” and “grade” can have different meanings according to country. In United States students group according to age in grades 1 until 12. Grades 1 until 8 belong to the basic school, and 9 until 12 to the high school.
In United Kingdom years lead students of alike age, that started to learn around the same time. The American grade is like a British form or year. First graders in United States match year two students in United Kingdom, so they differ in one year.
At Harvard you once used a numerical system of 1 until 200. Math and philosophy had 1 until 100. After 1883 Harvard passed to a system of classes from I until V, where V showed failure.
Platforms like Goodreads allow readers rate books by means of stars. However the rating commonly seems limited. Choosing between 3 and 4 stars is difficult when a book falls in between.
Books with 3.75 until 3.9 stars show the transition between good and bad reading. Four stars or more on Goodreads strongly urge you to take a book, but the number of samples matters. One five-star review ruins thewhole rating.